PG&E, SCE, or SDG&E? Here's How Much Your Electric Rates Rose Over the Last Decade
PG&E, SCE, or SDG&E? Here's How Much Your Electric Rates Rose Over the Last Decade (70% -101%)
California's Public Utilities Commission Public Advocates Office has released its Q1 2026 Electric Rates Report, and for the first time in a while, it breaks the state's rate growth down utility by utility rather than as a single statewide average. The results, drawn from data California utilities are required to report under state law SB 695, show meaningful differences depending on which utility serves your home.
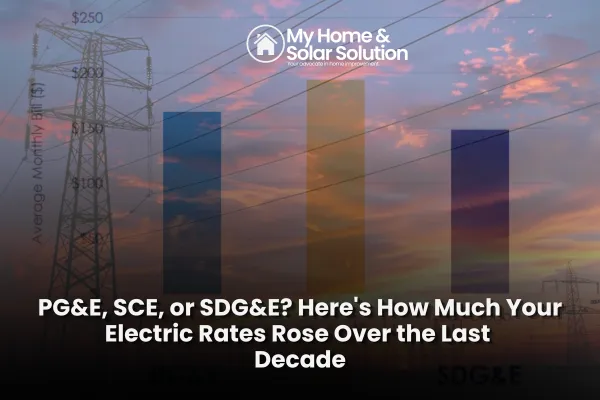
Since 2016, residential electric rates have climbed:
PG&E: up 69%
SCE: up 101%
SDG&E: up 98%
In other words, SCE customers have seen their rates more than double over the past decade, while PG&E customers — despite frequently making headlines for high bills — have actually seen a comparatively smaller (though still dramatic) increase.
Why the Differences Exist
Rate increases vary by utility for several reasons: differences in wildfire risk and mitigation spending across service territories, the age and condition of transmission and distribution infrastructure, the size and mix of each utility's customer base, and the pace of capital investment each utility has pursued and had approved by regulators. SCE's steeper increase has been driven in significant part by wildfire mitigation spending across its large, high-fire-risk service territory in Southern California, along with substantial investment in grid hardening and undergrounding of power lines.
What All Three Have in Common
Despite the differences in magnitude, the underlying story is the same across all three utilities: rate growth has significantly outpaced inflation for a full decade, and the primary drivers are structural — wildfire costs, aging infrastructure, and capital investment programs that earn utilities a guaranteed rate of return — not customer usage patterns or, as some utility messaging has suggested, rooftop solar adoption.
What This Means If You're a Homeowner
If you're a PG&E, SCE, or SDG&E customer, this report is a useful data point regardless of which specific number applies to your bill: all three of California's major investor-owned utilities have delivered rate increases well beyond what inflation alone would explain, and the structural drivers behind those increases — wildfire risk, grid investment — aren't going away. Lower Electric Bill by 50%: See if you qualify for solar panels and batteries without leasing, financing, or paying cash That reality is a significant part of why solar and battery adoption has continued growing across California even as compensation for exported solar power has become less generous under NEM 3.0. Generating and storing your own power doesn't eliminate your utility bill, but it does reduce how much of it is exposed to increases that, by the state's own reporting, have been running well ahead of inflation for years — regardless of which utility serves your home.
My Home & Solar Solution can show you exactly what solar and battery storage would mean for your home under your specific utility's current rate structure — PG&E, SCE, or SDG&E. Visit myhomesolution.org to see the numbers.

