California Energy Brief · June 2026
California 2026 energy rates
are historically high.
What it means for your bill — and what you can do.
This brief explains how investor-owned utilities source and price power, why the CPUC approves rate increases, and what the long-term data means for SCE, PG&E, and SDG&E customers in 2026.
Section 01 · How it works
How investor-owned utilities source power and bill you for it
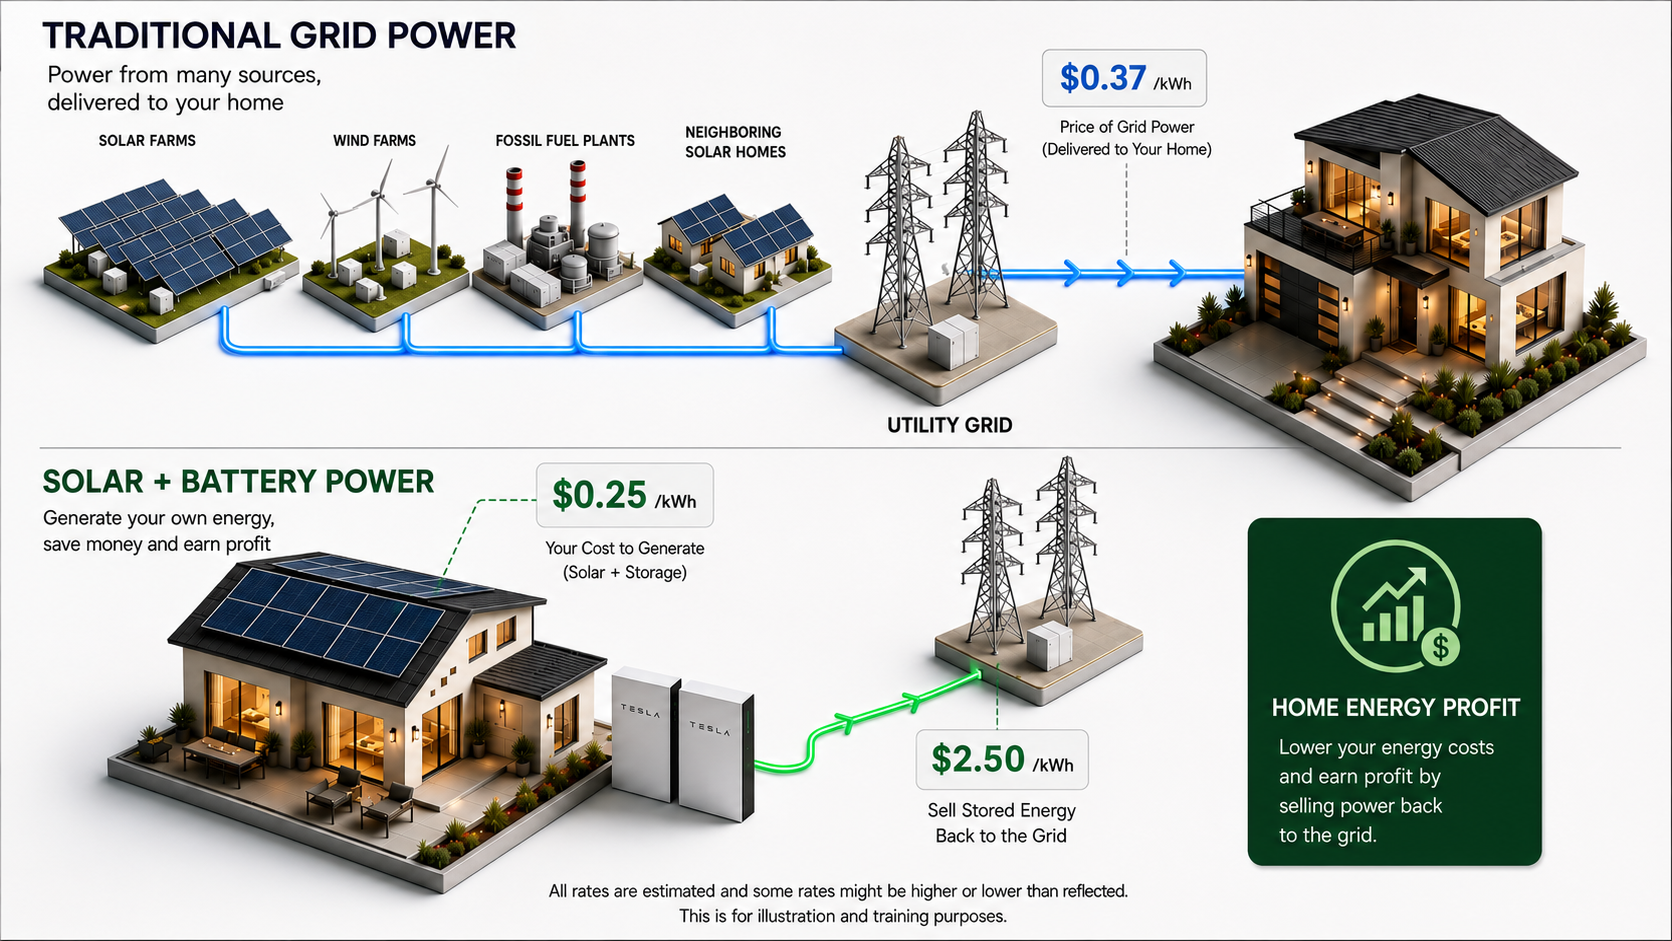
Most California homes are served by one of three investor-owned utilities: Southern California Edison (SCE), Pacific Gas & Electric (PG&E), or San Diego Gas & Electric (SDG&E). These companies do not just generate electricity — they act as the middleman between dozens of energy sources and your meter.
Understanding this chain is key to understanding your bill. Power flows through three distinct stages before it reaches your home, and each stage adds cost.
Most residential customers are "bundled" — the utility handles generation, transmission, and distribution together and charges you a single per-kWh rate that covers all three. When the CPUC approves a rate increase, it can be tied to any one of those layers.
The diagram below shows how traditional grid power compares to a solar + battery setup in terms of what you pay vs. what you can generate and sell back.
Section 02 · The rate approval process
Why utilities request rate increases — and how the CPUC approves them
California's investor-owned utilities are regulated monopolies. They cannot charge whatever they want — every rate change must be proposed to and approved by the California Public Utilities Commission (CPUC). But the process heavily favors cost recovery.
"The CPUC's cost-of-capital framework is designed to attract investment. That authorized return on equity — typically 10–10.3% for SCE — is baked into the rate you pay per kilowatt-hour."
The major cost drivers behind recent increases
Section 03 · Historical data & true effective rate
What households actually pay: base rates + TOU summer peak combined
The CPUC bundled average shown above understates what most households pay. It only captures the January 1 blended rate — it does not account for the summer TOU peak premium charged from June through September (October for SDG&E). The true effective rate is calculated the same way you would measure it: total annual electricity spend ÷ total annual kWh consumed.
Because roughly 14% of annual household kWh falls during peak hours (4 summer months × ~35% summer usage share × ~40% peak hour share), and because peak rates now run 1.8–2.0× the base rate — versus only 1.45× in 2006 — the real effective rate is meaningfully higher than what the CPUC graph shows.
Effective Rate = (86% × Base Rate) + (14% × Peak Rate)
Peak rates have grown from ~1.45× base in 2006 to ~1.90× base in 2026. SCE's current TOU-D peak rate is 58¢/kWh vs. a ~31¢ base average. This widening multiplier is a second, hidden driver of bill increases on top of rising base rates.
The gap between the CPUC base rate and the true effective rate has widened since 2020. As utilities pushed more customers onto TOU plans and increased the peak-to-off-peak spread, households using power in the evening are paying 13–20% more per kWh than the headline CPUC number suggests.
Section 04 · Summer peak pricing
Summer rates: when you use power most, it costs the most
All three utilities use Time-of-Use (TOU) pricing to charge premium rates during peak demand windows. In summer, that premium window hits exactly when you need cooling most — weekday evenings from 4 to 9 PM.
Starting from a bundled average rate of ~14¢/kWh in 2006, summer peak rates in 2026 now range from 34–47¢/kWh depending on your utility and time of use.
The grid peaks in the late afternoon when businesses are still running, people arrive home, air conditioning ramps up, and solar generation begins to fall. The EIA reports that U.S. electricity demand peaks in July or August due to widespread air conditioning use — and utilities price accordingly.
Southern California Edison · Ventura County & Greater LA
SCE customers: what's changed and what it means
SCE serves most of Ventura County and the greater Los Angeles basin. Its bundled system average rate was 16.40¢/kWh in 2020. By 2024 it had reached 26.90¢/kWh — a 64% increase in just four years.
| Metric | 2020 | January 2026 | 6-Year Change |
|---|---|---|---|
| Bundled avg rate (¢/kWh) | 16.40¢ | ~34.5¢ | +110% |
| Avg residential bill/mo | ~$115 | $187.56 | +63% |
| CARE (income-qualified) bill | ~$72 | $112.40 | +56% |
| With Climate Credit applied | — | 33.2¢/kWh effective | — |
What's driving SCE's rate increases
SCE's January 2026 advisory shows a modest short-term decrease, but the drivers of long-term increases remain in place. The 2025 General Rate Case added $476 million in annual revenue requirement. Thomas Fire and Montecito recovery bonds added $122 million. And the newly approved Woolsey Fire securitization — $1.951 billion financed over 2027–2061 — adds an estimated +0.25¢/kWh to non-CARE customer rates.
SCE service area customer?
See what a fixed-rate power program could mean for your SCE bill
Explore SCE Program OptionsPacific Gas & Electric · Northern & Central California
PG&E customers: the steepest climb of the three
PG&E has seen the largest rate increase of the three major California utilities since 2006 — a 165.7% increase from 13.76¢/kWh in 2006 to 36.57¢/kWh in 2024. Even with a January 2026 decrease, PG&E customers pay some of the highest residential electricity rates in the continental United States.
| Metric | 2020 | January 2026 | 6-Year Change |
|---|---|---|---|
| Bundled avg rate (¢/kWh) | 21.55¢ | 41.46¢ | +92% |
| CARE rate (bundled) | ~14¢ | ~28¢ | +100% |
| New Base Services Charge | N/A | ~$24/mo (most customers) | New in March 2026 |
| CARE Base Services Charge | N/A | ~$6/mo | New in March 2026 |
The new PG&E bill restructure — March 2026
Starting March 1, 2026, PG&E added a mandatory Base Services Charge to all electric bills: approximately $24/month for most customers, $6/month for CARE, and $12/month for FERA. The CPUC required this change to separate some fixed infrastructure costs from per-kWh prices. PG&E states it does not increase total revenue collected — but it does mean customers now pay a fixed charge regardless of how little electricity they use.
What the Jan 2026 "decrease" actually means: PG&E's bundled residential non-CARE average rate dropped from 44.36¢ to 41.46¢ under Advice Letter 7797-E — a 6.5% decrease from one of the highest rates in PG&E history. The CPUC historical workbook shows PG&E rates were 13.76¢ in 2006. A temporary decrease from record highs is not the same as rates returning to historically normal levels.
PG&E service area customer?
Explore fixed-rate options that reduce your exposure to PG&E's rate swings
Explore PG&E Program OptionsSan Diego Gas & Electric · San Diego & Southern Orange County
SDG&E customers: highest peak summer rates of the three
SDG&E serves San Diego and parts of southern Orange County. While its 2024 bundled average rate (31.53¢/kWh) is lower than PG&E, SDG&E reached a peak of 38.47¢/kWh in 2023 — the highest single-year average of all three utilities. Its summer TOU season also runs through October, one month longer than SCE and PG&E.
| Metric | 2020 | 2024 | Change |
|---|---|---|---|
| Bundled avg rate (¢/kWh) | 24.07¢ | 31.53¢ | +31% |
| Peak year on record | — | 38.47¢ (2023) | Highest of 3 utilities |
| Rate since 2006 | — | +126.2% | +126% over 18 yrs |
| Summer TOU season | Jun–Sep | Jun–Oct | Extended season |
SDG&E's 2028–2031 efficiency program request
In application A.26-03-012, SDG&E is requesting $460 million over 2028–2031 for energy-efficiency programs — about $175 million (38%) for the SDREN program. If approved, the proposed residential electric impact is 0.007¢/kWh, or roughly $0.04/month at 400 kWh. The gas impact is about $0.15/month at 24 therms, peaking in 2031. This is a small near-term add, but reflects the ongoing pattern of cost stacking approved by CPUC.
SDG&E service area customer?
Explore options to lock in a fixed rate and add battery backup for your San Diego home
Explore SDG&E Program OptionsSection 08 · What you can do
Your options when utility rates keep moving
You cannot stop the CPUC from approving rate increases. But you can change how exposed your household is to the per-kWh price. Here are three practical steps.
-
1
Read your utility's rate advisory
Each utility is required by the CPUC to publish plain-language rate advisories whenever rates change. It's the fastest way to see what changed on your account, why it changed, and when the next change is expected.
-
2
Participate in the public comment window
The Woolsey recovery bond proceeding (A.26-01-007) and SCE's income-qualified program application (A.26-01-005) are both open for public input. Your comment becomes part of the official CPUC record and is reviewed before a final decision.
-
3
Consider a fixed-rate, battery-backed energy program
MHSS helps California families access a utility-linked battery-backed energy program at no cost to access, with a fixed monthly rate. Through a third-party ownership (TPO) structure under a utility-aligned program, qualifying homes can add solar, battery backup, and a predictable rate — without taking on the variable per-kWh exposure described throughout this brief.
Find the right program for your utility below:
California customers facing historically high kWh rates
See what a fixed-rate power program could mean for your bill.
No cost to access. A fixed rate. Backup power when the grid goes down. Start by checking whether your address qualifies.
Sources
- 1CPUC, "Electric Rates." cpuc.ca.gov
- 2CPUC, "Rate Change Advisories." cpuc.ca.gov
- 3SCE, "Rate Advisory January 2026." sce.com
- 4SCE, "TOU Residential Rate Plans." sce.com
- 5SCE, "Woolsey Fire Recovery Bond Notice (A.26-01-007)." sce.com
- 6SCE, "Income Qualified Programs Notice (A.26-01-005)." sce.com
- 7PG&E, "Electric Rate Advisory January 2026." pge.com
- 8PG&E, "Restructured Electric Bill March 2026." pge.com
- 9SDG&E, "2026 Energy Efficiency Application Notice (A.26-03-012)." sdge.com
- 10CPUC, "Historical Electric Cost Data." cpuc.ca.gov
- 11CPUC, "2025 Senate Bill 695 Report." cpuc.ca.gov
- 12CPUC, "What Is Cost of Capital?" cpuc.ca.gov
- 13U.S. EIA, "U.S. Hourly Electricity Demand Peaked in July." eia.gov
- 14CPUC, "SCE Consent to Financing Order (A.26-01-007)." cpuc.ca.gov